Santa Ynez Valley Association of Realtors
  • Home
  • Find a Realtor
  • Search the MLS
    • Search the MLS
    • Open Houses
    • New Listings
  • SYVAOR
    • Board of Directors
    • Affiliates
    • Realtor Resources
    • Real Estate Links
    • Continuing Education for REALTORS
    • Ethics Statement
  • Market Trends
  • Valley Info
  • Contact

Homebuyers are not bothered by higher rates or taxes, but sellers are

3/23/2018

0 Comments

 
​
Existing home sales up 3.0% in February  10:11 AM ET Wed, 21 March 2018 | 01:22Home sales rebounded more strongly than expected in February, and the National Association of Realtors says they could have been even higher if there were more homes for sale. 

A critical shortage of listings is the No. 1 obstacle, especially in higher price ranges — not rising mortgage rates or new tax laws that reduce certain homeowner deductions.
In fact, homes sales in the West, where prices are highest, jumped more than 11 percent for the month, and the higher end of the market was very active. Nationally, sales of homes priced above $750,000 were up nearly 19 percent from a year ago. New tax laws limit the mortgage interest deduction. Borrowers can now deduct interest paid on up to $750,000 in mortgage debt. Previously, the limit was $1 million in mortgage debt.
Sales at the lowest end of the market, however, homes priced under $100,000, were down 16.5 percent compared with a year ago.
That is the range where the supply shortage is worst.
Home sales did fall sharply in the Northeast, where property taxes are very high in some states, but the Realtors say that was more due to horrendous weather than anything else.
Realtors polled for the monthly survey said they are hearing very few concerns from buyers about rising mortgage rates or the new tax laws, even fewer concerns than in December, when the tax laws were in final debate. That is not the case for potential sellers.
"The one concerning trend is the interest rate lock effect," said Lawrence Yun, chief economist at the NAR. Sellers are telling agents increasingly that they do not want to move because they will lose the record-low mortgage rate they have locked in.
The February sales figures, however, are based on contracts signed one to three months earlier, when rates hadn't moved higher yet.
"That said, higher rates are actually spurring buyers to step up and lock in with a purchase and a funding rate before they head even higher," said Peter Boockvar, chief investment officer at Bleakley Advisory Group. "This was seen in the weekly mortgage application data [last week] where purchases rose 1.4 percent week to week and 6.2 percent year over year."
Mortgage rates are not historically high today, but they are about half a percentage point higher since the start of this year and are clearly on an upward trajectory.
"Mortgage rates are at their highest level in nearly four years, at a time when home prices are still climbing at double the pace of wage growth," added Yun. "Homes for sale are going under contract a week faster than a year ago, which is quite remarkable given weakening affordability conditions and extremely tight supply. To fully satisfy demand, most markets right now need a substantial increase in new listings."
0 Comments

More Properties Were Sold At or Above List Price in January 2018

3/8/2018

1 Comment

 
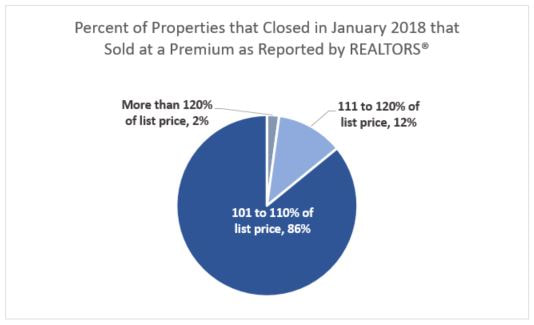
​In a monthly survey of REALTORS®, the survey asks, “Compared to the original listing price, at
how much of a net discount or net premium did the property sell?”

According to a survey of REALTORS® who responded to the January 2018 REALTORS®
Confidence Index Survey, 34 percent of properties that closed in January 2018 sold at or above the
list price. One year ago, 31 percent sold at or above the list price, and during the months of January
in 2012 through 2015, about one in four sold at or above the list price. Buyer demand continues to
outpace supply of homes being listed for sale in the market, sustaining the upward pressure on
home prices.

Picture
​Lack of inventory, which has pushed up prices, continues to erode home affordability. At the current
sales’ pace, the inventory of homes for sale in January 2018 will be exhausted in 3.2 months, well
below the norm of six months that keeps demand and supply at a healthy balance. Since 2012,
median home prices have cumulatively increased by 56 percent, nearly four times the 14 percent
cumulative change in earnings during the same period.
Written by Scholastica (Gay) Cororaton, Research Economist on February 28, 2018
1 Comment

Santa Ynez Valley Real Estate Market, 2017 Recap and 2018 Forecast

1/31/2018

0 Comments

 
Picture

It is a new year. It’s time to analyze how the Santa Ynez real estate market fared in 2017 and determine what might happen in 2018. The real estate market in the Santa Ynez Valley* performed quite well in 2017. The end of the year statistics for 2017 show that the Santa Ynez Valley (SYV) finished the year with a strong December that contributed to a strong 4th quarter. Sales and prices for the entire year were up significantly over the prior year, as shown in Table 1. The Santa Ynez real estate market in 2017 has continued to improve and the California Association of Realtors (CAR) forecasts similar growth for 2018. 
 
In December, sales of single family residences in the SYV increased to 23 units sold from 16 units sold in December 2016, up 43.8%. The median price increased 6.7% from $740,540 to $790,000 while the average sales price increased 6.5% from $843,072 to $898,256. As a further sign of strength, the average days on the market (DOM) decreased significantly, from 238 days to 81 days, down 66%. Not only were sale and prices up, homes were selling quicker than the previous December.
 
In the 4th quarter, sales in the Valley increased from 65 units in 2016 to 75 units in 2017, up 15.4%. The median price increased 11.4% from $660,000 to $735,000 while the average sales price increased 11.0% from $841,039 to $933,638. The DOM confirmed the broad market strength in the SYV market during this time period. The DOM had similar improvement with a decrease from 155 days to 105 days, down 32.3%.

SYV Association of Realtors recorded 328 single family residences sold in 2017 compared to 289 units sold in 2016, an increase of 13.5%. The SYV median price in 2017 was up 6.2% from 2016. It increased from $697,000 to $740,500. The average sales price for the year was up 3.8% from $992,763 in 2016 to $1,030,296 in 2017. The DOM decreased 5.9% in 2017 from 153 days in 2016 to 144 days.
 
December, the 4th quarter, and the year; all of these time periods reported positive numbers in each category. It was a very healthy year for Santa Ynez Valley real estate. In California, sales of existing single family homes were up 1.4% and the median sales price was up 7.6% in 2017. SYV did much better in sales, up 13.5%, and was reasonably close on median price, up 6.2%. The 12% difference in sales may appear extreme but is an acceptable variation in a small market as is the Valley. The SYV 2017 real estate market performed comparably with the rest of the California real estate market.

​

​


​CAR predicts that the state's existing home sales will increase 1.0% and that the median price will increase by 4.2% in 2018. The Santa Ynez Valley should see similar numbers, but this forecast did not account for the Federal tax reform that was passed in December 2017. Most taxpayers are concerned how this reform is going to affect their pocketbook. The limitations on the mortgage interest deduction, the state tax deduction, and property tax deduction are not going to be a large enough burden to stop a robust economy like the mortgage meltdown affected the economy did back in 2007. Current economic indicators and the recent performance of the stock market suggest that America is in a robust economic period. If any forecasts need adjusting, CAR may need to adjust their numbers upward, not downward. 2017 was a good year for the Santa Ynez Valley real estate market and 2018 appears to have economic factors that will create more growth, similar to 2017.
 
By Rodney Smeester
REALTOR®, DRE # 01925202
SYVAOR Board Member & MLS Committee Chairman

0 Comments

​California housing market downshifts in April as housing shortage cuts into demand, C.A.R. reports

5/17/2017

1 Comment

 
​California housing market downshifts in April as housing shortage cuts into demand, C.A.R. reports
  • Existing, single-family home sales totaled 406,300 in April on a seasonally adjusted annualized rate, down 2.4 percent from March and down 1.7 percent from April 2016.
  • April’s statewide median home price was $536,750, up 3.7 percent from March and up 5.4 percent from April 2016.
  • At the regional level, the San Francisco Bay Area, Inland Empire, and Los Angeles metro area all registered year-to-year sales declines of 4.3 percent, 3.1 percent, and 6.4 percent, respectively.
 
LOS ANGELES (May 16) – Following a strong first quarter start, California home sales lost momentum in April, while the median home price accelerated to a near-10-year high, the CALIFORNIA ASSOCIATION OF REALTORS® (C.A.R.) said today.
   
Closed escrow sales of existing, single-family detached homes in California remained above the 400,000 benchmark for the 13th consecutive month and totaled a seasonally adjusted annualized rate of 406,300 units in April, according to information collected by C.A.R. from more than 90 local REALTOR® associations and MLSs statewide. The statewide sales figure represents what would be the total number of homes sold during 2017 if sales maintained the April pace throughout the year. It is adjusted to account for seasonal factors that typically influence home sales. The April figure was down 2.4 percent from the 416,110 level in March and down 1.7 percent compared with home sales in April 2016 of a revised 413,270.

“With pending home sales slowing over the past three months, April’s sales decline was not a surprise,” said C.A.R. President Geoff McIntosh. “Some sales that took place in the first quarter were likely pulled forward as homebuyers took advantage of the favorable interest rate environment and decided to purchase now before rates increase. Moving forward, the housing market may temper further as interest rates inch up and the supply of available homes for sale tightens.”

The statewide median price stayed above the $500,000 mark for the second straight month and reached the highest level since August 2007. The median price was up 3.7 percent from $517,490 in March to reach $536,750 in April, and was 5.4 percent higher than the $509,240 recorded in April 2016. The median sales price is the point at which half of homes sold for more and half sold for less; it is influenced by the types of homes selling, as well as a general change in values.

“California’s median home price has been on an upward trend on an annual basis since March 2012 and is now at the highest in nearly 10 years,” said C.A.R. Senior Vice President and Chief Economist Leslie Appleton-Young. “The yearly price gains will most likely persist through the remainder of the home-buying season, further exacerbating an already-low housing affordability situation. This could have an adverse effect on home sales in the upcoming months, especially since interest rates are expected to rise in the second half of the year.”

Other key points from C.A.R.’s April 2017 resale housing report include:

·         The April sales decline was broad based as every major region in the state posted a decline over the previous year. Southern California dropped the most with a 6.5 percent decline in existing home sales from last April. 

·         After a strong March showing in sales, the Bay Area housing market dipped again as housing supply and affordability continued to constrain sales in the region.  Overall sales in the Bay Area declined 4.3 percent over the same period last year. Seven of the nine counties in the region performed worse than last April. 
 
·         New statewide active listings declined for the 22nd month in April, falling 10.5 percent from a year ago.
 
·         The April decline in sales relieved housing inventory conditions slightly, with C.A.R.’s Unsold Inventory Index edging up from 3.0 months in March to 3.3 months in April. The index measures the number of months needed to sell the supply of homes on the market at the current sales rate. The index stood at 3.5 months in April 2016.

·         At the county level, 35 of 51 reported counties experienced a drop in the unsold inventory index compared to a year ago. San Francisco had the lowest inventory (1.8 months), followed by Santa Clara, San Mateo, and Alameda (all at 2.0 months), which were all in the Bay Area.
 
·         The median number of days it took to sell a single-family home dipped from 26.7 days in March to 24.1 days in April and was down from 27.8 days in April 2016.
 
·         C.A.R.’s sales-to-list price ratio* was 100 percent of listing prices statewide in April, 99.3 percent in March, and 99.3 percent in April 2016.
 
·         The average price per square foot** for an existing, single-family home statewide was $258 in April, $252 in March, and $244 in April 2016.
                                                   
·         San Mateo County had the highest price per square foot in April at $890/sq. ft., followed by San Francisco ($887/sq. ft.), and Santa Clara ($698/sq. ft.). Counties with the lowest price per square foot in April included Lassen ($119/sq. ft.), Siskiyou ($119/sq. ft.), and Tulare ($132/sq. ft.).
 
·         Mortgage rates have fallen since early this year. The 30-year, fixed-mortgage interest rate averaged 4.05 percent in April, down from 4.20 percent in March but up from 3.69 percent in April 2016, according to Freddie Mac. The five-year, adjustable-rate mortgage interest rates dipped in April to an average of 3.15 percent, from 3.21 percent in March but was up from 2.90 percent in April 2016.

Graphics (click links to open):
·         April sales at-a-glance infographic.
·         Calif. historical existing home sales.
·         Calif. historical median home price.
·         Share of sales by price range.
·         Calif. price per square foot.
·         Calif. sales to list price ratio.

Note:  The County MLS median price and sales data in the tables are generated from a survey of more than 90 associations of REALTORS® throughout the state, and represent statistics of existing single-family detached homes only. County sales data are not adjusted to account for seasonal factors that can influence home sales.  Movements in sales prices should not be interpreted as changes in the cost of a standard home.  The median price is where half sold for more and half sold for less; medians are more typical than average prices, which are skewed by a relatively small share of transactions at either the lower-end or the upper-end. Median prices can be influenced by changes in cost, as well as changes in the characteristics and the size of homes sold.  The change in median prices should not be construed as actual price changes in specific homes.

*Sales-to-list price ratio is an indicator that reflects the negotiation power of home buyers and home sellers under current market conditions. The ratio is calculated by dividing the final sales price of a property by its last list price and is expressed as a percentage.  A sales-to-list ratio with 100 percent or above suggests that the property sold for more than the list price, and a ratio below 100 percent indicates that the price sold below the asking price.

**Price per square foot is a measure commonly used by real estate agents and brokers to determine how much a square foot of space a buyer will pay for a property.  It is calculated as the sale price of the home divided by the number of finished square feet.  C.A.R. currently tracks price-per-square foot statistics for 39 counties.

Follow us on Twitter @CAR Media and @CAREALTORS®
Like us on Facebook, and check us out on Instagram.
​
Leading the way…® in California real estate for more than 110 years, the CALIFORNIA ASSOCIATION OF REALTORS® (www.car.org) is one of the largest state trade organizations in the United States with 185,000 members dedicated to the advancement of professionalism in real estate. C.A.R. is headquartered in Los Angeles.
1 Comment

California pending home sales dip slightly in January; Southern California market continues to outshine other regions, C.A.R. reports

3/3/2017

0 Comments

 
LOS ANGELES (Feb. 24) – Following relatively strong closed escrow home sales over the past few months, California pending home sales slipped negligibly from a year ago, which suggests a softening in the housing market in the upcoming months, the CALIFORNIA ASSOCIATION OF REALTORS® (C.A.R.) said today.

Reflecting a seasonal pattern, REALTORS® responding to C.A.R.’s January Market Pulse Survey** saw a bounceback in floor calls, listing appointments, and open house traffic from December.

Pending home sales data:
  • Based on signed contracts, statewide pending home sales decreased in January on a seasonally adjusted basis, with the Pending Home Sales Index (PHSI)* slipping 0.2 percent from 107.4 from January 2016 to 107.2 in January 2017. On a monthly basis, California pending home sales were down 9.2 percent from the December index of 118.0.
  • Only the Southern California region posted a year-over-year improvement in pending sales last month, rising 8.1 percent from January 2016 and increasing 10.5 percent on a monthly basis. Riverside County led the region in pending sales, posting a 16.2 percent increase from a year ago. Los Angeles, Orange, and San Diego counties also posted modest year-over-year increases of 7.1 percent, 8.0, and 4.0 percent, respectively. San Bernardino County was the only area within Southern California that saw pending sales lower on an annual basis by 2.8 percent.
  • For the San Francisco Bay Area as a whole, tight housing supplies and low affordability contributed to a fall in pending sales of 9.7 percent compared to January 2016. Only San Mateo County posted an annual increase, rising 5.3 percent from January 2016 after posting a significant double-digit annual decline (35.3 percent) in December. Pending home sales decreased 21.2 percent in San Francisco County, 7.1 percent in Santa Clara County, 24.9 percent in Monterey, and 4.8 percent in Santa Cruz County. A shortage of homes on the market and poor affordability will likely persist throughout the year, and impact Bay Area home sales.
  • Pending sales in the Central Valley fell 7.9 percent from January 2016 and were up 2.2 percent from December. Within Central Valley, pending sales were down 14.6 percent in Kern County and 11.8 percent in Sacramento compared with a year ago.

January REALTOR® Market Pulse Survey**:
While pending sales were lower in January, California REALTORS® responding to C.A.R.’s January Market Pulse Survey expect improved market conditions in the near term, as they reported an increase in floor calls, listing appointments, and open house traffic compared to December.
  • The share of homes selling above asking price rose from 17 percent a year ago to 25 percent in January. Conversely, the share of properties selling below asking price decreased to 38 percent from 47 percent in January 2016. The remaining 36 percent sold at asking price, unchanged from January 2016.
  • For homes that sold above asking price, the premium paid over asking price dipped to 8.6 percent, down from 9.8 percent a year ago.
  • The 38 percent of homes that sold below asking price sold for an average of 17 percent below asking price in January, compared to 13 percent a year ago.
  • About two-thirds of properties for sale (62 percent) received multiple offers in January, down from 66 percent in January 2016.
  • The share of properties receiving three or more offers in January was 32 percent, compared to 34 percent a year ago.
  • The share of homes priced $400,000 to $499,000 posted the largest gain in receiving three or more offers, rising from 28 percent in January 2016 to 37 percent in January 2017. Homes priced under $200,000 posted the greatest drop in receiving three or more offers.
  • Just under one-fourth (24 percent) of properties had listing price reductions in January, unchanged from January 2016.
  • Rising for the fifth straight month, a lack of available inventory was the top concern for 36 percent of REALTORS®. Eroding housing affordability/high interest rates concerned 29 percent of REALTORS®. Inflated home prices/housing bubble was cited by 14 percent of REALTORS®. A slowdown in economic growth, lending and financing, and policy and regulations rounded out REALTORS®’ remaining biggest concerns.
  • REALTORS®’ expectation of market conditions over the next year flattened out in January at an index of 65, slightly down from an index of 66 a year ago.
Graphics (click links to open):
  • YTY change in pending home sales by region.
  • More properties selling above asking price.
  • Share of properties receiving multiple offers.
  • Price range of homes receiving 3+ offers.
  • Lack of inventory tops REALTORS®’ concerns.
 
Follow us on Twitter @CAR Media and @CAREALTORS®
Like us on Facebook, and check us out on Instagram.

*Note:  C.A.R.’s pending sales information is generated from a survey of more than 70 associations of REALTORS® and MLSs throughout the state. Pending home sales are forward-looking indicators of future home sales activity, offering solid information on future changes in the direction of the market. A sale is listed as pending after a seller has accepted a sales contract on a property. The majority of pending home sales usually become closed sales transactions one to two months later. The year 2008 was used as the benchmark for the Pending Homes Sales Index. An index of 100 is equal to the average level of contract activity during 2008.

**C.A.R.’s Market Pulse Survey is a monthly online survey sent to more than 10,000 California REALTORS® to measure data about their last closed transaction and sentiment about business activity in their market area for the previous month. Approximately 300 REALTORS® responded.

Leading the way...® in California real estate for more than 110 years, the CALIFORNIA ASSOCIATION OF REALTORS® (www.car.org) is one of the largest state trade organizations in the United States with more than 185,000 members dedicated to the advancement of professionalism in real estate. C.A.R. is headquartered in Los Angeles.

0 Comments

Higher wages and seasonal price declines hold California housing affordability in check, C.A.R. reports

2/14/2017

0 Comments

 
·  Thirty-one percent of California households could afford to purchase the $511,360 median-priced home in the fourth quarter, unchanged from third-quarter 2016 and up from 30 percent in fourth-quarter 2015.

·  A minimum annual income of $100,800 was needed to make monthly payments of $2,520, including principal, interest, and taxes on a 30-year fixed-rate mortgage at a 3.91 percent interest rate.

·  Forty percent of home buyers were able to purchase the $413,700 median-priced condo or townhome. An annual income of $81,550 was required to make a monthly payment of $2,040.

LOS ANGELES (Feb. 9) – Rising wages and seasonal price declines held California’s housing affordability steady in fourth-quarter 2016, even while interest rates rose moderately, the CALIFORNIA ASSOCIATION OF REALTORS® (C.A.R.) said today.
​
The percentage of home buyers who could afford to purchase a median-priced, existing single-family home in California in fourth-quarter 2016 remained at 31 percent, unchanged from the third quarter of 2016 but was up from 30 percent in fourth-quarter 2015, according to C.A.R.’s Traditional Housing Affordability Index (HAI). This is the 15th consecutive quarter that the index has been below 40 percent and is near the mid-2008 low level of 29 percent. California’s housing affordability index hit a peak of 56 percent in the third quarter of 2012.

C.A.R.’s HAI measures the percentage of all households that can afford to purchase a median-priced, single-family home in California. C.A.R. also reports affordability indices for regions and select counties within the state. The Index is considered the most fundamental measure of housing well-being for home buyers in the state.

Home buyers needed to earn a minimum annual income of $100,800 to qualify for the purchase of a $511,360 statewide median-priced, existing single-family home in the fourth quarter of 2016. The monthly payment, including taxes and insurance on a 30-year, fixed-rate loan, would be $2,520, assuming a 20 percent down payment and an effective composite interest rate of 3.91 percent. The effective composite interest rate in third-quarter 2016 was 3.76 percent and 4.07 percent in the fourth quarter of 2015.

Homes were slightly more affordable in fourth-quarter 2016 compared to fourth-quarter 2015, when the affordability index stood at 30 and the median home price was $484,710. An annual income of $96,980 was needed to make monthly payments of $2,420.

The affordability of condominiums and townhomes also was flat compare to the previous quarter. Forty percent of California households earned the minimum income to qualify for the purchase of a $413,700 median-priced condominium or townhome in the fourth quarter of 2016, and an annual income of $81,550 was required to make monthly payments of $2,040.

Key points from the fourth-quarter 2016 Housing Affordability report include:
  • Compared to affordability in third-quarter 2016, eight of 29 counties tracked saw an improvement in housing affordability (Contra Costa, Marin, Napa, Los Angeles, Ventura, Monterey, Santa Barbara, and Madera), 10 experienced a decline (San Francisco, Sonoma, Orange County, Riverside, San Bernardino, Santa Cruz, Kern, Kings, Merced, and San Joaquin), and 11 were unchanged (Alameda, San Mateo, Santa Clara, Solano, San Diego, San Luis Obispo, Fresno, Placer, Sacramento, Stanislaus, and Tulare).
  • Only three (Contra Costa, Marin, Napa) of nine Bay Area counties recorded higher affordability numbers than the previous quarter, as higher earning Bay Area workers drove up home prices. Housing affordability results were mixed in Southern California but largely declined in Central Valley counties (Kern, Kings, Merced, San Joaquin).
  • During the fourth quarter of 2016, the most affordable counties in California were Kings (56 percent); Kern (55 percent); San Bernardino (54 percent); and Fresno (50 percent).
  • San Francisco (13 percent), San Mateo (15 percent), and Santa Cruz (17 percent) counties were the least affordable areas in the state.
Housing Affordability slides (click link to open)
Affordability peak versus current
Annual required income peak vs. current
PITI peak versus current
CA housing affordability by quarter (2006-2016)
See C.A.R.’s historical housing affordability data.
See third-time buyer housing affordability data.

Follow us on Twitter @CAR Media and @CAREALTORS®  Like us on Facebook.

Leading the way…® in California real estate for more than 110 years, the CALIFORNIA ASSOCIATION OF REALTORS® (www.car.org) is one of the largest state trade organizations in the United States with more than185,000 members dedicated to the advancement of professionalism in real estate. C.A.R. is headquartered in Los Angeles.
0 Comments

California home sales register nominal annual increase in September for first time in seven months, C.A.R. reports

10/19/2016

1 Comment

 
  • Existing, single-family home sales totaled 425,680 in September on a seasonally adjusted annualized rate, up 1.3 percent from August and 0.8 percent from September 2015.
  • September’s statewide median home price was $514,320, down 2.3 percent from August and up 6.1 percent from September 2015.
  • Statewide sales of condos and townhomes fell 8.5 percent from August and were up 1.4 percent from September a year ago.
LOS ANGELES (Oct. 17) – California existing home sales ticked up in September on a year-over-year basis for the first time in seven months as a shortage of homes available for sale continues to hold back the market, the CALIFORNIA ASSOCIATION OF REALTORS® (C.A.R.) said today.
Closed escrow sales of existing, single-family detached homes in California totaled a seasonally adjusted annualized rate of 425,680 units in September, according to information collected by C.A.R. from more than 90 local REALTOR® associations and MLSs statewide  The statewide sales figure represents what would be the total number of homes sold during 2016 if sales maintained the September pace throughout the year.  It is adjusted to account for seasonal factors that typically influence home sales.
The September figure was up 1.3 percent from the revised 420,360 level in August and up 0.8 percent compared with home sales in September 2015 of a revised 422,360.  Home sales remained above the 400,000 pace for the sixth straight month, and the year-over-year increase was the first since January.
“While higher sales both on a monthly and an annual basis is a glimmer of good news, with most of the home-buying season behind us for 2016, it’s not , the CALIFORNIA ASSOCIATION OF REALTORS® (www.car.org) is one enough to tip the scales for an increase above 2015’s sales pace,” said C.A.R. President Pat “Ziggy” Zicarelli.  “With listings continuing to decline and demand still strong, especially at the lower end of the market, affordability will remain a challenge for would-be buyers.”
The statewide median price remained above the $500,000 mark for the sixth straight month, with minimal signs of cooling down outside of a few select markets. The median price of an existing, single-family detached California home was down 2.3 percent in September to $514,320 from $526,580 in August. September’s median price increased 6.1 percent from the revised $484,670 recorded in September 2015. The median sales price is the point at which half of homes sold for more and half sold for less; it is influenced by the types of homes selling, as well as a general change in values. The monthly price decline is primarily due to seasonal factors.
“While demand remains strong for lower-priced homes, which are more inventory constrained, sales of homes at the higher-end have slowed significantly,” said C.A.R. Vice President and Chief Economist Leslie Appleton-Young. “For example, sales of properties priced between $2 million and $3 million, which are the least inventory constrained, grew by high double-digits in 2014 and 2015, but the pace has slowed down to a negligible 0.2 percent increase through the first nine months of this year.”
Other key points from C.A.R.’s September 2016 resale housing report include:
  • Current home prices in the state are still 13.5 percent below their previous peak, though most parts of the San Francisco Bay Area have already reached new all-time highs.
 
  • C.A.R.’s Unsold Inventory Index, which indicates the number of months needed to sell the supply of homes on the market at the current sales rate inched up to 3.5 months in September from 3.4 months in August. The index stood at 3.6 months in September 2015.
 
  • Statewide active listings continue to decline, falling 3.1 percent from August and 4.9 percent from a year ago. The year-over-year listings decline is the highest since January 2016.
 
  • The median number of days it took to sell a single-family home was unchanged from August at 28.9 days but was down from 31.8 days in September 2015.
 
  • C.A.R.’s sales-to-list price ratio* dipped slightly in September, with sales prices slightly decreasing to 98.6 percent of listing prices statewide in September from 98.9 percent in August and flat from September 2015.
 
  • The average price per square foot** for an existing, single-family home statewide reached a post-recession high in September at $249, up from $246 in August and from $235 in September 2015.
 
  • San Francisco County had the highest price per square foot in September at $852/sq. ft., followed by San Mateo ($759/sq. ft.), and Santa Clara ($612/sq. ft.). Counties with the lowest price per square foot in September include Tehama ($123/sq. ft.), Siskiyou ($126/sq. ft.), and Tulare and Kings both at $128/sq. ft.
 
  • Mortgage rates are expected to remain low in the foreseeable future, though the Federal Reserve is expected to raise interest rates by year’s end. Mortgage rates edged slightly higher in September, with the 30-year, fixed-mortgage interest rate averaging 3.46 percent, up from 3.44 percent in August but down from 3.89 percent in September 2015, according to Freddie Mac.  The five-year, adjustable-rate mortgage interest rates also rose in September to an average of 2.81 percent, up from 2.75 percent in August but down from 2.92 percent in September 2015.
Graphics (click links to open):
  • September sales at-a-glance infographic.
  • Calif. existing home sales historical.
  • Share of sales by price range.
  • Historical condo sales.
  • CA price per square foot.
  • Regional ratio of sales to active listings.
Note:  The County MLS median price and sales data in the tables are generated from a survey of more than 90 associations of REALTORS® throughout the state, and represent statistics of existing single-family detached homes only.  County sales data are not adjusted to account for seasonal factors that can influence home sales.  Movements in sales prices should not be interpreted as changes in the cost of a standard home.  The median price is where half sold for more and half sold for less; medians are more typical than average prices, which are skewed by a relatively small share of transactions at either the lower-end or the upper-end. Median prices can be influenced by changes in cost, as well as changes in the characteristics and the size of homes sold.  The change in median prices should not be construed as actual price changes in specific homes.

*Sales-to-list price ratio is an indicator that reflects the negotiation power of home buyers and home sellers under current market conditions.  The ratio is calculated by dividing the final sales price of a property by its last list price and is expressed as a percentage.  A sales-to-list ratio with 100 percent or above suggests that the property sold for more than the list price, and a ratio below 100 percent indicates that the price sold below the asking price.

**Price per square foot is a measure commonly used by real estate agents and brokers to determine how much a square foot of space a buyer will pay for a property.  It is calculated as the sale price of the home divided by the number of finished square feet.  C.A.R. currently tracks price-per-square foot statistics for 39 counties.
​
Leading the way…® in California real estate for more than 110 years, the CALIFORNIA ASSOCIATION OF REALTORS® (www.car.org) is one  of the largest state trade organizations in the United States with 185,000 members dedicated to the advancement of professionalism in real estate. C.A.R. is headquartered in Los Angeles.
1 Comment

California housing market loses momentum in August as affordability crunch stifles home sales, C.A.R. reports

9/16/2016

1 Comment


- Existing, single-family home sales totaled 420,360 in August on a seasonally adjusted annualized rate, up 1.1 percent from July and down 2.2 percent from August 2015.
- At $526,580, August’s statewide median home price is at its highest level in nearly seven years.
- Year-to-date sales are down from the previous year for the second month in a row by 0.5 percent.
LOS ANGELES (Sept. 15) – California home sales downshifted in August as low housing affordability and a tight supply of homes for sale cut into demand, especially in high cost areas of the San Francisco Bay region, the CALIFORNIA ASSOCIATION OF REALTORS® (C.A.R.) said today.
Closed escrow sales of existing, single-family detached homes in California totaled a seasonally adjusted annualized rate of 420,360 units in August, according to information collected by C.A.R. from more than 90 local REALTOR® associations and MLSs statewide.  The statewide sales figure represents what would be the total number of homes sold during 2016 if sales maintained the August pace throughout the year.  It is adjusted to account for seasonal factors that typically influence home sales.
The August figure was up 1.1 percent from the revised 415,840 level in July and down 2.2 percent compared with home sales in August 2015 of a revised 429,900.  Home sales remained above the 400,000 pace for the fifth straight month, but sales have declined year over year for the sixth consecutive month.
“We are seeing the market tempering, which is being driven by reduced affordability and not enough homes for sale on the market, particularly in the San Francisco Bay regions, where runaway home prices have constrained home sales,” said C.A.R. President Pat “Ziggy” Zicarelli.  “Two of the region’s least affordable counties – Marin and Santa Clara – saw sales fall from a year ago, while Contra Costa and Sonoma counties experienced more modest slowdowns.  Conversely, in many parts of the Central Valley, where homes are more affordable and demand has been relatively strong, home sales posted healthy increases. Likewise, sales of condominiums statewide were strong, thanks to their relative affordability.”
The statewide median price remained above the $500,000 mark for the fifth straight month and is at its highest level in nearly seven years.  There are, however, signs of an expected slowing in price growth.  The median price of an existing, single-family detached California home was up 1.7 percent in August to $526,580 from $517,650 in July. August’s median price increased 5.8 percent from the revised $497,520 recorded in August 2015.  The median sales price is the point at which half of homes sold for more and half sold for less; it is influenced by the types of homes selling as well as a general change in values.  The continuing rising home prices despite falling sales suggests that demand continues to outstrip new supply coming online, which is pushing prices higher.
“As jobs and incomes have continued to improve for workers in the state, we’re seeing more demand by primary homebuyers at the lower end of the market where inventory is tightest, which is pushing home prices higher,” said C.A.R. Vice President and Chief Economist Leslie Appleton-Young.  “With active listings in the lowest price tier dropping more than 27 percent from the previous year, the median home price of the lowest priced segment of the market was pushed up from $185,000 last year to $205,000 this August, while the next price segment of the market has risen from $300,000 to $320,000.”
Other key points from C.A.R.’s August 2016 resale housing report include:
· C.A.R.’s Unsold Inventory Index, which indicates the number of months needed to sell the supply of homes on the market at the current sales rate deteriorated from both last month and last year, dipping to 3.4 months in August from 3.6 months in July. The index stood at 3.6 months in August 2015.
· With the exception of Ventura, all of Southern California saw its unsold inventory decline as the market got tighter in August. Inventory either was unchanged or up over the past year in all Bay Area counties except Napa and Sonoma as new listings have started to come on the market.
· The median number of days it took to sell a single-family home edged up slightly in August to 28.9 days, compared with 28 days in July and 29.7 days in August 2015.
· C.A.R.’s sales-to-list price ratio* dipped in August, with sales prices slightly decreasing to 98.9 percent of listing prices statewide in August from 99.2 percent in July and essentially flat from 98.8 percent in August 2015.
· The average price per square foot** for an existing, single-family home statewide was $246 in August 2016, down from $247 in July but up from $235 in August 2015.
· San Francisco County had the highest price per square foot in August at $818/sq. ft., followed by San Mateo ($782/sq. ft.), and Marin ($632/sq. ft.). Counties with the lowest price per square foot in August include Del Norte ($106/sq. ft.), Siskiyou ($123/sq. ft.), and Tulare ($127/sq. ft.).
· Mortgage rates are expected to remain low in the foreseeable future as weak global economic growth will likely be the norm in the upcoming months. Mortgage rates declined in August, with the 30-year, fixed-mortgage interest rate averaging 3.44 percent, unchanged from July and down from 3.91 percent in August 2015, according to Freddie Mac.  Adjustable-rate mortgage interest rates also were unchanged in August at an average of 2.75 percent, essentially unchanged from 2.74 percent in August 2015.
Graphics (click links to open):
 August sales at-a-glance infographic.
 Calif. existing home sales historical.
 Share of sales by price range.
 Historical condo sales.
 CA price per square foot.
 CA sales to list price ratio.
Note:  The County MLS median price and sales data in the tables are generated from a survey of more than 90 associations of REALTORS® throughout the state, and represent statistics of existing single-family detached homes only.  County sales data are not adjusted to account for seasonal factors that can influence home sales.  Movements in sales prices should not be interpreted as changes in the cost of a standard home.  The median price is where half sold for more and half sold for less; medians are more typical than average prices, which are skewed by a relatively small share of transactions at either the lower-end or the upper-end.  Median prices can be influenced by changes in cost, as well as changes in the characteristics and the size of homes sold.  The change in median prices should not be construed as actual price changes in specific homes.
*Sales-to-list price ratio is an indicator that reflects the negotiation power of home buyers and home sellers under current market conditions.  The ratio is calculated by dividing the final sales price of a property by its last list price and is expressed as a percentage.  A sales-to-list ratio with 100 percent or above suggests that the property sold for more than the list price, and a ratio below 100 percent indicates that the price sold below the asking price.

**Price per square foot is a measure commonly used by real estate agents and brokers to determine how much a square foot of space a buyer will pay for a property.  It is calculated as the sale price of the home divided by the number of finished square feet.  C.A.R. currently tracks price-per-square foot statistics for 39 counties.
1 Comment

California home sales and median price decrease in July as affordability crunch puts dent in housing market, C.A.R. reports

8/21/2015

0 Comments

 
California home sales and median price decrease in July as affordability crunch puts dent in housing market, C.A.R. reports
● Existing, single-family home sales totaled 415,840 in July on a seasonally adjusted annualized rate, down 4.1 percent from June and 5.1 percent from July 2015.
●July’s statewide median home price was $509,830, down 1.8 percent from June and up 3.9 percent from July 2015.
●Year-to-date sales are down from the previous year for the first time in more than a year and a half by 0.3 percent.
Los Angeles (August 16) – California home sales stumbled in July as low inventories and eroding affordability dragged down the housing market, the California Association of REALTORS® (C.A.R.) said today.
Closed escrow sales of existing, single-family detached homes in California totaled a seasonally adjusted annualized rate of 415,840 units in July, according to information collected by C.A.R. from more than 90 local REALTOR® associations and MLSs statewide. The statewide sales figure represents what would be the total number of homes sold during 2016 if sales maintained the July pace throughout the year.  It is adjusted to account for seasonal factors that typically influence home sales.
The July figure was down 4.1 percent from the revised 433,600 level in June and down 5.1 percent compared with home sales in July 2015 of a revised 438,230. Home sales remained above the 400,000 pace for the fourth straight month, but sales have declined year over year for the fifth consecutive month.
“Despite the tight housing supply conditions that have persisted over the past few years, home sales have stayed relatively solid,” said C.A.R. President Pat “Ziggy” Zicarelli. “Even with a shortage of homes on the market, low rates and strong demand have been the norm. Some regions, such as the Bay Area, are seeing an uptick in inventory as high prices are motivating sellers to list their properties for sale. While this could ease the inventory somewhat, supply remains tight, and low affordability is expected to be an issue in the short term.”
The statewide median price remained above the $500,000 mark for the fourth straight month, but there are signs of an expected slowing in price growth. The median price of an existing, single-family detached California home slipped 1.8 percent in July to $509,830 from $519,410 in June.  July’s median price increased 3.9 percent from the revised $490,780 recorded in July 2015.  The median sales price is the point at which half of homes sold for more and half sold for less; it is influenced by the types of homes selling as well as a general change in values.  More homes being sold at the high end of the market (over $1 million) and slightly fewer sales at the lower end (under $300,000) contributed to the year-over-year gain in the median price.
“California’s median home price rose again in July from last year, but the pace of increase has clearly slowed down in recent months,” said C.A.R. Vice President and Chief Economist Leslie Appleton-Young.  “While fundamentals such as increasing household formation and strong job creation continue to fuel housing demand and support price growth, low housing affordability and reduced buying power of home buyers has put a cap on how fast the statewide median price can grow.”
Other key points from C.A.R.’s July 2016 resale housing report include:
● C.A.R.’s Unsold Inventory Index, which indicates the number of months needed to sell the supply of homes on the market at the current sales rate, inched up to 3.6 months in July from 3.2 months in June.  The index stood at 3.3 months in July 2015.
● The Bay Area region continued to see an increase in inventory, with all counties except Solano and Sonoma seeing an increase from the previous year.  Active listings in Los Angeles, the Inland Empire, San Diego, and the Central Valley declined compared to July 2015.
● The median number of days it took to sell a single-family home edged up slightly in July to 28 days, compared with 27.1 days in June and 29 days in July 2015.
● C.A.R.’s sales-to-list price ratio* dipped in July, with sales prices slightly decreasing to 99.2 percent of listing prices statewide in July from 99.6 percent in June and 99.1 percent in July 2015.
● The average price per square foot** for an existing, single-family home statewide was $247 in July 2016, down from $248 in June but up from $241 in July 2015.
● San Francisco County had the highest price per square foot in July at $824/sq. ft., followed by San Mateo ($788/sq. ft.), and Marin ($606/sq. ft.). Counties with the lowest price per square foot in July include Madera ($127/sq. ft.), Tulare ($128/sq. ft.), and Siskiyou ($131/sq. ft.).
● Mortgage rates are expected to remain low in the foreseeable future due to global economic uncertainty. Mortgage rates declined in July, with the 30-year, fixed-mortgage interest rate averaging 3.44 percent, compared with 3.57 percent in June and 4.05 percent in July 2015, according to Freddie Mac.  Adjustable-rate mortgage interest rates slipped in July to an average of 2.75 percent, a decline from 2.78 percent in June and 2.96 percent in July 2015.
Graphics (click links to open):
● July sales at-a-glance infographic.
● Calif. existing home sales historical.
● Share of sales by price range.
● Historical condo sales.
● CA price per square foot.
● CA sales to list price ratio.
Note:  The County MLS median price and sales data in the tables are generated from a survey of more than 90 associations of REALTORS® throughout the state, and represent statistics of existing single-family detached homes only.  County sales data are not adjusted to account for seasonal factors that can influence home sales.  Movements in sales prices should not be interpreted as changes in the cost of a standard home.  The median price is where half sold for more and half sold for less; medians are more typical than average prices, which are skewed by a relatively small share of transactions at either the lower-end or the upper-end.  Median prices can be influenced by changes in cost, as well as changes in the characteristics and the size of homes sold.  The change in median prices should not be construed as actual price changes in specific homes.
*Sales-to-list price ratio is an indicator that reflects the negotiation power of home buyers and home sellers under current market conditions.  The ratio is calculated by dividing the final sales price of a property by its last list price and is expressed as a percentage.  A sales-to-list ratio with 100 percent or above suggests that the property sold for more than the list price, and a ratio below 100 percent indicates that the price sold below the asking price.
**Price per square foot is a measure commonly used by real estate agents and brokers to determine how much a square foot of space a buyer will pay for a property.  It is calculated as the sale price of the home divided by the number of finished square feet.  C.A.R. currently tracks price-per-square foot statistics for 39 counties.

0 Comments

Commercial market Continues Recovery, Says NAR Chief Economist

5/18/2015

1 Comment

 
Media Contact: Jane Dollinger / 202-383-1042

WASHINGTON (May 14, 2015) – While the commercial market still faces its share of challenges, REALTORS® specializing in commercial real estate expressed confidence in the marked improvement seen in the market over the last year at a commercial economic issues and trends forum at the REALTORS® Legislative Meetings & Trade Expo.

National Association of REALTORS® Chief Economist Lawrence Yun led a panel discussion about the forces shaping commercial real estate markets. The panelists agreed that the market has improved and expressed confidence that continued recovery in the economy will drive commercial real estate growth.

“Commercial real estate usually recovers two years behind the economy; however, NAR members who practice commercial real estate are seeing a three-to-four year wait,” said Yun. “It has been a long and slow recovery, but it is happening.”

However, there are still headwinds facing the commercial sector. Subpar Gross Domestic Product growth, stagnating wage growth and low employment rates are all affecting demand for commercial properties. Improving those underlying fundamentals is instrumental in maintaining a strong commercial market, said Yun.

He said another major hurdle facing the recovery is the lack of financing available for small investors. While large companies can access financing from Wall Street or international buyers, most financing for smaller investors still comes from regional or local banks and credit unions. Many of those small banks are hesitant or reluctant to give out commercial loans.

“New financial regulations for all banks, big and small, are resulting in smaller banks bearing proportionally higher compliance costs,” said Yun. “Why are the little guys taking the brunt of this? Maybe there should be waivers for smaller banks so they can give out the loans businesses need and help with community development.”

Sam Chandan, founder and chief economist of Chandan Economics and associate faculty member at The Wharton School of the University of Pennsylvania, emphasized the importance of the narrative currently happening among commercial real estate investors, especially when it comes to multifamily homes.

“The narrative is that Millennials love to rent; they prefer the flexibility and proximity to amenities that comes with renting rather than owning,” said Chandan. “However, that fails to take into account that while Millennials will always be Millennials, Millennials will not always be in their twenties. You could ask a 22-year old at any point in history if they want to own a house in the suburbs, move away from urban centers, or own a minivan, etc., and they will say no. But that answer has changed in the past and it will change again, and the multifamily sector needs to develop a narrative that takes that into account.”

The same problem is affecting other commercial markets, such as retail. Online commerce has changed the way commercial retail positions itself and attracts buyers. “While it’s true that you will never be able to get a haircut online, the same cannot be said for buying books or groceries. We cannot assume that because people always shopped at grocery stores that they will not learn and adopt another way.” said Chandan. “The commercial market needs to develop a narrative that evaluates how flexible people are with their shopping habits.”

The National Association of REALTORS®, “The Voice for Real Estate,” is America’s largest trade association, representing 1 million members involved in all aspects of the residential and commercial real estate industries.

1 Comment
<<Previous

    Author

    Santa Ynez Valley Association of REALTORS®.

    We are a trade association with 139 REALTORS® members and 30 Affiliate members. Our members service the towns of Santa Ynez, Solvang, Buellton, Ballard, Los Olivos, and Los Alamos in the Santa Ynez Valley of California. 

    Archives

    March 2018
    January 2018
    May 2017
    March 2017
    February 2017
    October 2016
    September 2016
    August 2015
    May 2015
    April 2015
    July 2014
    May 2014

    Categories

    All

    RSS Feed

Picture
Picture
Useful Links
Santa Ynez Valley
Useful Links

Find a REALTOR
Market Trends
SYVAOR Affiliates
SYVAOR Board


Mailing Address
650 Alamo Pintado Road, Suite 201
Solvang, CA  93463

Phone & Email
(805) 688-7744
info@syvaor.com 

Home  | Realtor Resources  |  Privacy Policy  |  Terms of Use  | Contact
© 2022 -- Santa Ynez Valley Association of Realtors, All rights reserved.
The Santa Ynez Valley Association of Realtors®, in one with our organization's mission and vision, is committed to making our website accessible to everyone. At this time, we recognize that not all areas of our website may be sufficiently accessible to some of our visitors. We further recognize that some of our functionality and the associated content is complex, has contractual implications and, even with best efforts and intentions, may not be effective when used with screen readers or other devices. Given that our goal is to provide a website, content and functionality that is broadly accessible, we invite anyone requiring specific accommodations to contact us at (805) 688-7744 and ask to speak with the accessibility coordinator who will work with you to provide an effective accommodation.